Market Commentary | December 23rd, 2024
Week in Review…
Major U.S. equity indices declined for the week, driven by the Federal Reserve’s announcement of fewer interest rate cuts in 2025 than previously anticipated. This news heightened investor caution amid ongoing market volatility.
For the week ending December 20, 2024:
- The S&P 500 was down -1.99%
- The Dow Jones Industrial Average was down -2.25%
- The tech-heavy Nasdaq was down -2.25%
- The 10-Year Treasury yield ended the week at 4.53%

The Federal Reserve’s recent monetary policy decision and a series of economic indicators have painted a complex picture of the U.S. economy as 2024 draws to a close. The central bank announced its third consecutive rate cut of the year, lowering the federal funds rate by 25 basis points to a range of 4.25% to 4.5%. This decision came despite higher-than-anticipated inflation data, with the Consumer Price Index (CPI) rising 0.3% in November. The market’s relatively calm reaction suggests that inflation concerns may be taking a backseat to other economic factors.
The labor market continues to show resilience, but subtle signs of weakening have emerged, becoming a more critical factor in shaping market expectations for future monetary policy decisions. Initial jobless claims decreased to 220,000 from 229,000, while continuing claims saw a slight decline from 1,890,000 to 1,874,000, indicating a still-robust job market with some signs of moderation.
Economic indicators released in the lead-up to the Fed meeting provided a mixed outlook across various sectors. The Purchasing Managers’ Index (PMI) data revealed a slight contraction in manufacturing activity with a reading of 48.3. The housing market showed divergent trends, with building permits rising by 6.1% while housing starts fell by 1.8%. Third-quarter gross domestic product (GDP) figures were revised upward to a 3.1% annual growth rate, reflecting stronger consumer spending and exports. However, the Philadelphia Fed Index’s significant decline to -16.4 pointed to contraction in regional manufacturing activity. On a positive note, existing home sales reached a six-month high, increasing 4.8% from October.
The Personal Consumption Expenditures (PCE) data, the Federal Reserve’s preferred inflation measure, showed a 2.4% annual increase, slightly below expectations. Separately, the Conference Board Leading Economic Index® (LEI) for the U.S. increased by 0.3% in November 2024, marking its first rise since February 2022. This positive sign for future economic activity was supported by improvements in building permits, equity markets, and manufacturing hours worked, as well as fewer initial unemployment claims.
The aforementioned array of economic indicators will play a crucial role in shaping market perspectives on economic growth, inflation trends, and the Federal Reserve’s policy trajectory as we move into 2025.
The Fed’s updated projections now anticipate fewer rate cuts in the coming year, with only two reductions totaling 50 basis points expected in 2025, down from the full percentage point of cuts projected in the previous quarter.
Spotlight

The Unexpected Winner in Commercial Real Estate – Retail
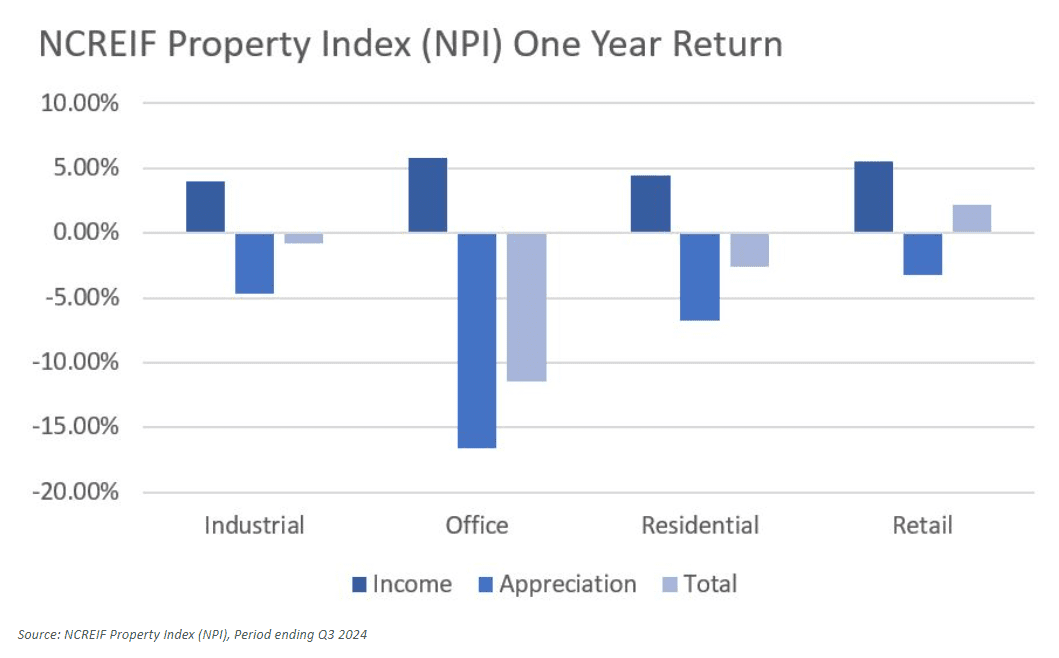
The Federal Reserve implemented a series of 11 interest rate hikes at an unprecedented pace between March 2022 and mid-2024 to combat inflation, resulting in a cumulative increase of 525 basis points in the Fed Funds rate. This aggressive monetary tightening significantly impacted Commercial Real Estate (CRE) performance. However, contrary to expectations, the retail sector emerged as a surprising bright spot for investors. According to the NCREIF Property Index (NPI), the benchmark for private institutional CRE performance, retail was the only core sector to deliver positive returns over the year leading up to the third quarter of 2024.


Before examining the reasons behind retail outperformance, it’s important to note that the NCREIF Property Index (NPI) typically responds with a lag due to its reliance on appraisals. Additionally, retail space performance can vary significantly across property subtypes such as malls, strip centers, and street-front locations.
The perception and demand for brick-and-mortar retail has markedly improved since the early 2010s. During that period, the retail sector faced significant challenges:
- High-profile bankruptcies in the aftermath of the Global Financial Crisis (GFC)
- Fears of e-commerce dominating the retail industry
- An oversupply of retail space
These factors contributed to substantial negative investor sentiment towards retail properties, leading to the widespread use of the term “retail apocalypse” to describe the market environment. However, recent years have seen a revitalization of physical stores, driven by:
- The COVID-19 pandemic
- The rise of hybrid shopping methods, such as “buy online, pickup in-store” (BOPIS)
Physical stores have evolved to become central hubs for goods distribution and revenue diversification for digital brands, reaffirming the demand for brick-and-mortar retail.
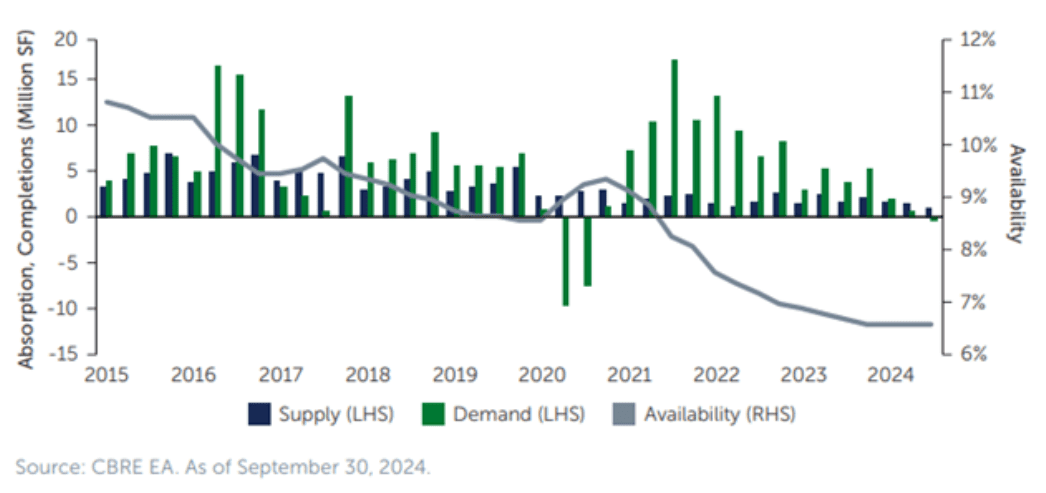
On the supply side, the fear of a “retail apocalypse” led to a significant decrease in retail space development after the GFC. According to Greenstreet:
- From 2001 to 2008, new supply averaged approximately 2.5% of the total stock annually
- In the following decade, new supply dropped to only about 0.5% of the existing stock per year
This lack of new supply, combined with strong retailer demand, has created a favorable market environment. As a result:
- Occupancy rates for retail properties are now at their highest levels ever recorded
- A backlog of leases is poised to drive strong Net Operating Income (NOI) growth
- Retailers are quickly re-tenanting spaces from bankrupt tenants, minimizing disruption for landlords
These factors collectively contribute to the current outperformance of the retail sector in the commercial real estate market.
Exhibit: Retail space is at the tightest level ever with minimal supply over the past decade

Retailers previously focused on mall-based models are now closing their traditional stores to explore expansion opportunities in newer open-air retail spaces. Given the strong economic climate and robust consumer spending, neighborhoods, community, and strip centers are likely to experience continued high demand. In contrast, traditional malls are expected to face ongoing performance challenges and softening demand.
Week Ahead…

Next week marks the arrival of the holiday season, with Christmas Eve and Christmas Day occurring in the middle of the week. As a result, financial markets are likely to take a pause. While the bulk of earnings reports are coming to an end, investors should still pay close attention to several important economic indicators, especially those related to consumer demand.
On Tuesday, December 24, key economic data will be released that will shed light on consumer spending trends. The Durable Goods Orders report, which tracks changes in orders for long-lasting goods, will act as a vital gauge of consumer confidence and economic vitality. A strong report typically reflects robust consumer sentiment and a healthy economy.
Additionally, revised building permit data will be published on the same day. Market participants will be keen to see if the initial upward revision holds steady. New home sales figures will also be closely watched, as they are essential indicators of consumer demand and economic activity. This report is particularly noteworthy since it is expected to be less influenced by earlier hurricanes, thereby providing a clearer picture of consumer behavior. Moreover, with stable 30-year mortgage rates, fluctuations in interest rates are unlikely to significantly impact housing demand.
On Monday, December 23, the Conference Board will unveil its Consumer Confidence report. This survey-based data on consumer sentiment, when analyzed alongside hard data on durable goods and housing sales, can provide a thorough understanding of the current consumer landscape. The state of consumer spending will be an important metric as we transition into the new year, offering insights into potential economic trends for 2025.
This content was developed by Cambridge from sources believed to be reliable. This content is provided for informational purposes only and should not be construed or acted upon as individualized investment advice. It should not be considered a recommendation or solicitation. Information is subject to change. Any forward-looking statements are based on assumptions, may not materialize, and are subject to revision without notice. The information in this material is not intended as tax or legal advice.
Investing involves risk. Depending on the different types of investments there may be varying degrees of risk. Socially responsible investing does not guarantee any amount of success. Clients and prospective clients should be prepared to bear investment loss including loss of original principal. Indices mentioned are unmanaged and cannot be invested into directly. Past performance is not a guarantee of future results.
The Dow Jones Industrial Average (DJIA) is a price-weighted index composed of 30 widely traded blue-chip U.S. common stocks. The S&P 500 is a market-cap weighted index composed of the common stocks of 500 leading companies in leading industries of the U.S. economy. The NASDAQ Composite Index is a market-value weighted index of all common stocks listed on the NASDAQ stock exchange.
